Recently I’ve started working on Funnel Cake, a sort of IFTTT for your marketing data (or any data, really). You can sign up for free and try it out here, but today I want to document my development workflow.
It’s been nearly 10 years since I’ve done heavy PHP or Javascript development, so I’m starting in some ways as a beginner again. It might be helpful for others to see how I’ve setup my development environment.
I’ve been working on iOS and Mac Objective-C development for the past years, and I wanted to bring some of that experience to this project. Namely:
- IDE that understands the class structure of my app
- Code completion
- Single click or keyboard command to get to a symbol definition or superclass
- Static analysis of the codebase
PhpStorm and Plugins
I settled on PhpStorm, a mature IDE from Jetbrians focused specifically to PHP and web development. Out of the box it already does a lot, but it’s static analysis of the code is a bit lacking. No worries, as it’s built with extensibility in mind. I quickly installed Php Extensions (EA Extended) plugin, which solved the majority of my wishes. It adds a number of additional inspections to PhpStorm’s already strong showing.
After installing, I choose Code -> Inspect Code from the menu, and a report is generated that shows all of the static analysis issues in my codebase, many with single-click automatic fixes.
Working with Composer
Some of the code in my project is obviously mine – this is the code I want to analyze. Some of the code is other frameworks I’m using, and I want the static analyzer to know about this code, but I don’t want it to report any analysis bugs in that code. It took me a bit to figure out how to set that up properly, but I was able to fix all of the issues by:
- Excluding the
vendorsfolder from theDirectoriespreferences area - Adding back each of the vendors’
srcfolders inLanguages & Frameworks -> PHPInclude Paths area - My project is PHP 7.3+ only, so I also set the
PHP Language Levelto 7.3 - Configured Composer in
Languages & Frameworks -> PHP -> Composerpreferences
Scopes
By default, the Find command (Cmd+Shift+F) will search the entire project, including composer’s vendors and test files. Similarly, the static analysis in Code -> Inspect Code will show you errors in your code, or test code, the vendor’s test code, etc. To get around this, you can setup a “Scope” for your project, and limit these commands to that scope.
Setup a new Scope in Appearance & Behavior -> Scopes, add new new scope, and then select any test folders or vendor folders that you don’t want to show up in the static analysis, and choose Exclude Recursively.
This won’t exclude these classes from analysis, but it will exclude any issues found in them from the report. This way, any code you rely on will type check properly, but you won’t get type-checking errors etc from that 3rd party code. Now you can use Code -> Inspect Code and get a report of only your code’s issues.
Inspections
PhpStorm has tons of static-analysis options built in, and you can opt in or out of each by toggling Inspections in Editor -> Inspections preference. The PhpExtensions (EA Extended) plugin adds inspections to this area as well, beefing up the analysis report.
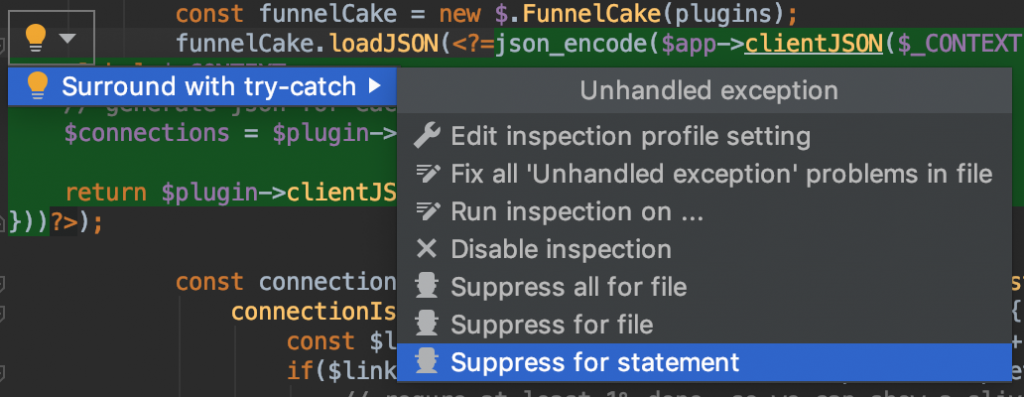
Some of these I’ve turned off, most of them I’ve left on, but it depends on you preference and codebase. Another handy feature is the ‘intention bulb’ that let’s you take quick action on any highlighted errors or warnings in your code.

As I’ve been tidying up my codebase, the bulb has been very helpful for applying quick fixes. As I get further along, I suspect I may turn it off, which you can do in Editor -> General -> Appearance and turn of the Show intention bulb setting.
Phan Integration
Phan is a static analyzer for PHP and can find type-safety issues in your codebase that PhpStorm can’t otherwise find out of the box. It’s great at finding logic errors where you may be returning the wrong type, or expecting a different type from a method than it returns. Is that an array of Animal or array of Dog? Phan knows, and it’ll help catch you when you remember wrong.
Unfortunately, there’s no Phan Plugin for PhpStorm, so instead it needs to run as an External tool. PhpStorm can run the phan console command and show the output inside a pane – conveniently also linking the src path in the output for easy click-to-find from the output. (I lost the link where I learned this, so thanks to whoever posted about this before!)
To help format phan’s output, I run the analysis with the following script in my projects root directory:
/location/to/phan > phan.out

cat phan.out | sed G | sed -E 's|([a-zA-Z0-9 _\./\-]+:[[:digit:]]+)|'"$(pwd)"'/\1\
|g' | fold -sw 150

num_matches=$(cat phan.out | wc -l | xargs);

if [ -s phan.out ]; then
        echo "There are ${num_matches} errors";
else
        echo "No errors";
fi

rm phan.out
Notice at the top of the script, you’ll need to specify where you’ve installed the phan binary. After that, running the script will output all of the errors it found. It will also convert the relative paths of the phan output to be absolute paths so that PhpStorm will auto-link them in the output.
There are numerous options for Phan, but I’ve kept my config very simple. I’ve included it below for reference:
<?php

/**
 * This configuration will be read and overlaid on top of the
 * default configuration. Command line arguments will be applied
 * after this file is read.
 */
return [
    // Supported values: `'5.6'`, `'7.0'`, `'7.1'`, `'7.2'`, `'7.3'`, `null`.
    // If this is set to `null`,
    // then Phan assumes the PHP version which is closest to the minor version
    // of the php executable used to execute Phan.
    //
    // Note that the **only** effect of choosing `'5.6'` is to infer
    // that functions removed in php 7.0 exist.
    // (See `backward_compatibility_checks` for additional options)
    // TODO: Set this.
    'target_php_version' => '7.3',

    // A list of directories that should be parsed for class and
    // method information. After excluding the directories
    // defined in exclude_analysis_directory_list, the remaining
    // files will be statically analyzed for errors.
    //
    // Thus, both first-party and third-party code being used by
    // your application should be included in this list.
    'directory_list' => [
        'library',
        'vendor/google',
        'vendor/tplaner/when',
        'vendor/monolog/monolog',
        'vendor/dibi/dibi',
        'vendor/sendgrid/sendgrid',
        'vendor/sendgrid/php-http-client',
        'vendor/nesbot/carbon',
        'config',
    ],

    // A regex used to match every file name that you want to
    // exclude from parsing. Actual value will exclude every
    // "test", "tests", "Test" and "Tests" folders found in
    // "vendor/" directory.
    'exclude_file_regex' => '@^vendor/.*/(tests?|Tests?)/@',

    // A directory list that defines files that will be excluded
    // from static analysis, but whose class and method
    // information should be included.
    //
    // Generally, you'll want to include the directories for
    // third-party code (such as "vendor/") in this list.
    //
    // n.b.: If you'd like to parse but not analyze 3rd
    //       party code, directories containing that code
    //       should be added to both the `directory_list`
    //       and `exclude_analysis_directory_list` arrays.
    'exclude_analysis_directory_list' => [
        'vendor/'
    ],
];
I’ve left the comments of phan’s own sample config file for reference, but a few notes about the config:
- In the
directory_list, include any directories of your code or 3rd party code. This is what phan will analyze. - In the
exclude_analysis_directory_list, include all 3rd party code. This will exclude any issues in 3rd party code from showing in phan’s report. - Set
target_php_versionto whatever is correct for your project
Now that phan is configured, you can manually run phan from the command line with the script:
./run_phan.sh
Next, let’s integrate this into PhpStorm so that you can run it easily from within the IDE and turn all those file paths into clickable links. In Preferences -> Tools -> External Tools, click to add a new tool. Name it whatever you want, select the run_phan.sh script as the Program, and set your project’s directory as the working directory. Last, set the Output filters to $FILE_PATH$:$LINE$.
That’s it – now you can run the phan analysis from within PhpStorm from Tools -> External Tools -> Phan menu. It will open up a console tab and show you the output with clickable links to each problem.

PHP Docblocks
Most of the code I write in PHP is strongly typed, though I do dip into untyped code from time to time, that flexibility is one of the reasons I love PHP. The static analysis that’s available now for the strongly typed code is fantastic, but the language isn’t as descriptive as I’d always like it to be.
That’s where docblocks come in. The static analysis above also reads the @param and @return types defined in dock blocks, and uses that for its analysis. This is incredibly helpful for defining type expectations that otherwise aren’t possible in code, such as generics in @param array<int,string>.
Clearly defining types with generics when possible has helped the analysis find bugs that otherwise would’ve taken me an enormous amount of time to find. It’s also incredibly helpful for documenting variable types, such as:
/** @var string $myvar */
$myvar = 4; // static analysis warning
Keyboard and Mouse Shortcuts
There’s a few very handy Find keyboard shortcuts in PhpStorm. The first two are common across many IDEs: Find in Files is Cmd+Shift+F. Find Class is Command+O. Two others that are equally helpful are Find Symbol Command+Option+O and Find File Command+Shift+O. I’ve actually swapped the shortcuts for Find File and Find Class so that Find Class matches Xcode, but I use all of these very frequently.
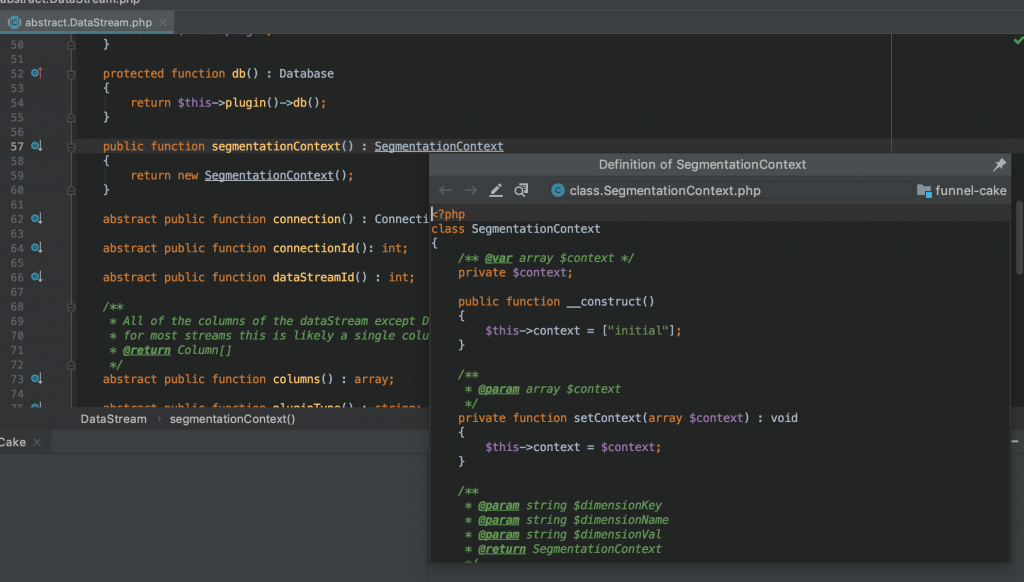
I also set Quick Definition to Option+Click to mirror Xcode’s Go to Documentation shortcut. This shows the declaration of whatever symbol is under my mouse cursor, very handy for hard to remember method parameters.


I added Command+S to the Escape command, as by habit I save my files to close any auto-completion popup. Better to save too often than not often enough!
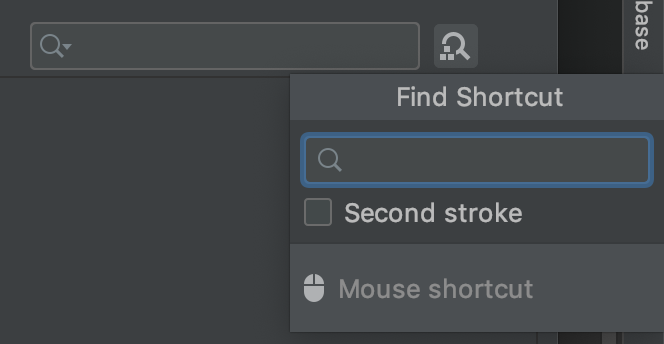
Adding or editing other shortcuts is easy, as I could either search for the command by name or by its current shortcut.
Still More to Learn
I’m only a few months back on the saddle with PHP, so I’m sure that there is still more for me to learn about PhpStorm and PHP 7.3, but I’m really happy with where I’ve gotten my setup for development.