I’ve been very fortunate to not have suffered a repetitive strain injury in my years at the keyboard, until now. Over the past few months, I’ve started to get some pain in my right wrist. I type on a macbook pro keyboard, and it seems to be from how I turn my wrist to reach the backspace key in particular (we’re not all perfect typists!).
I attribute my lack of pain so far to a combination of luck and possibly my hand position when typing. Instead of twisting my wrist to have my hands straight on the keyboard, I keep my wrists straight which leaves my fingers tilted on the keyboard. This lets my fingers travel straight to the keys on the rows above and below, almost like i’m forcing an ortho hand position into the staggered keyboard layout.


This serves me well, except (!) for when I hit the backspace key. For that, I twist my right wrist and use my ring finger to reach for the backspace key. My pinky is too short to reach without moving my whole hand, but the ring finger can reach with only a twist of the wrist. The motion to hit enter with the pinky is a similar twist.
The other cause of twisting my wrist is using my right hand with the track pad. Moving the cursor on the trackpad means I’m making many small twisting motions with my wrist. I’d like to minimize these if possible as well, though this motion is much less of a problem than the backspace and enter keys.
Unfortunately, all this wrist twisting has given me ulnar wrist pain – pain on the pinky side tendon.
If I stay with plain laptop keyboards, I don’t see my wrist behavior changing anytime soon, which means this is just the beginning of what would be permanent pain. I need to come up with a solution so that I don’t need to twist my wrist at all when I type – and that means a new keyboard adventure!
Using the trackpad less
Much of my trackpad use is for simple things that I can change with better keyboard shortcuts. I use Xcode almost exclusively, and still use the mouse for certain things – switching between files, and even build and running an application. For these, I can learn the built in keyboard shortcuts so that I don’t need to move my hands to the trackpad at all.
For other things, I’ll sometimes use cmd+tab to switch between applications, or cmd+space to launch applications from Spotlight. Still, for things like clicking links, clicking apps on the doc, navigating Mail or Slack, I still reach for the trackpad. To help that, I’ve found an amazing app Shortcat. Using a hot key and text search, you can tab through accessibility labels on screen to quickly click any element. It’s a fantastic way to quickly click around on screen without fiddling with the mouse cursor at all, and still be able to reach places that aren’t able to be configured for shortcuts.
I’m not entirely sure if it’s still under active development, but I’ve bought the license to the beta all the same and am eager for any future updates to this very helpful app.
An ergonomic keyboard
The most important next step is to find a keyboard where I won’t need to twist my wrist. My colleague Ray also has RSI in their pinky, and uses a minimal Corne split keyboard with great success. It looked like just what I’d need, though that was fewer keys than I’d be able to jump to straight away.
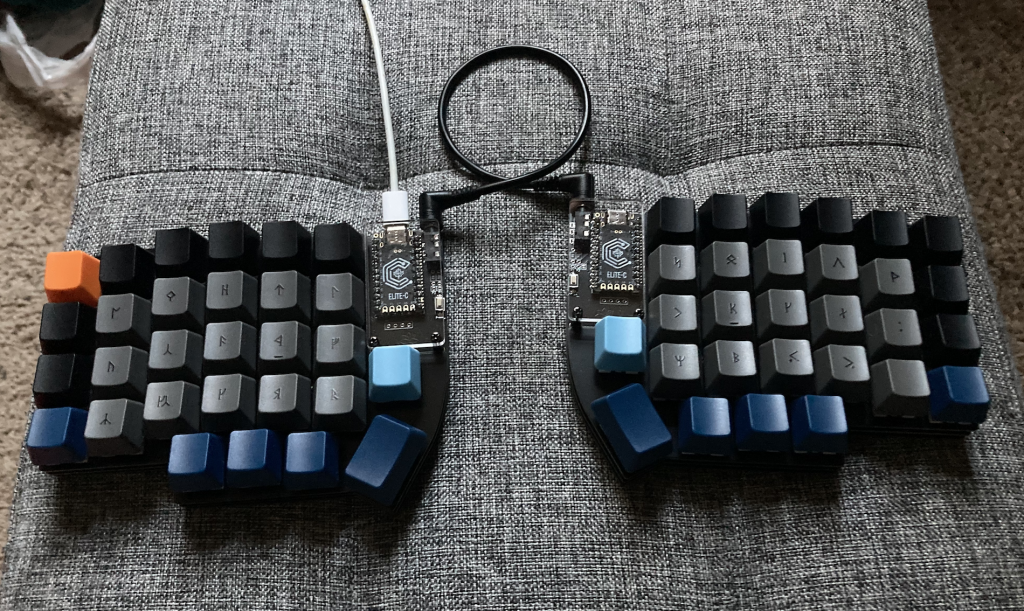
I needed something small enough to easily travel with me to coffee shops or move around my house to my patio without any effort, but close enough to a laptop number of keys that the transition wouldn’t be horrific. I settled on the Lily58, and bought a kit from Boardsource.xyz.

I’ve only had it fully assembled for a little more than a day, but I’m so excited about the possibilities here. Instead of my two thumbs sharing a single spacebar, I now have 8 keys for them to use. This let’s me move work that my right pinky was doing and delegate it to the thumbs instead. My enter key and backspace are now handled by the thumbs, and the compact nature of the keyboard means virtually zero wrist movement while typing.
Key layout
Since I need to learn a new keyboard, I’ve decided to learn a new layout as well. Qwerty is notorious for its inefficient finger movement. My entire purpose with this project is to reduce wrist and finger movement, so it’s the perfect time to learn a more efficient layout as well.
I started learning about the Dvorak, Workman, and Colemak layouts, and the videos by Ben Vallack have been extremely helpful – both for learning about keymaps and also learning about keyboard layers.
My goals for learning a new key layout is to reduce finger movement while typing. I’d say I’m an ok qwerty typist, fast enough and moderately accurate. I’d like to take this opportunity to learn a more efficient layout and focus on accuracy and good typing habits.
I’ve settled on the Colemak DH layout, largely inspired by this video from Ben Vallack. One issue with changing any layouts is that many of the keyboard shortcuts we’re used to are designed for the qwerty layout – things like cmd+z and cmd+c. The Colemak keeps these keys in the same positions, while still moving most commonly used letters to the home row and less commonly used letters to above/below rows. Letters like E R and T find themselves comfortably sit on the home row, for a lot less finger movement while typing.
Layers
For keyboards that have far fewer keys than a traditional keyboard, what do you do about arrow keys or symbols? The solution is custom layers – just like the shift key switches all of the lower case letters to be upper case, these custom keyboards use QMK to add in custom ‘layers’ to hold the other characters. Keys can be mapped to ‘shift’ the keyboard into another layer, replacing all of the alphanumeric keys with symbols, or arrow keys, or even mouse/scroll keys.
I’m still working on my own layer definitions, but for now I have a default colemak layer, a qwerty layer, a symbol layer, an arrow key layer, and a mouse layer. I’ve configured everything using the free QMK configurator. Incredibly, the site even compiles the custom firmware for me to flash onto the keyboard, so I haven’t needed to fiddle with a local development environment for it yet, thankfully.
My layout is by no means final, but here’s what I’m starting off with:
Learning to type again

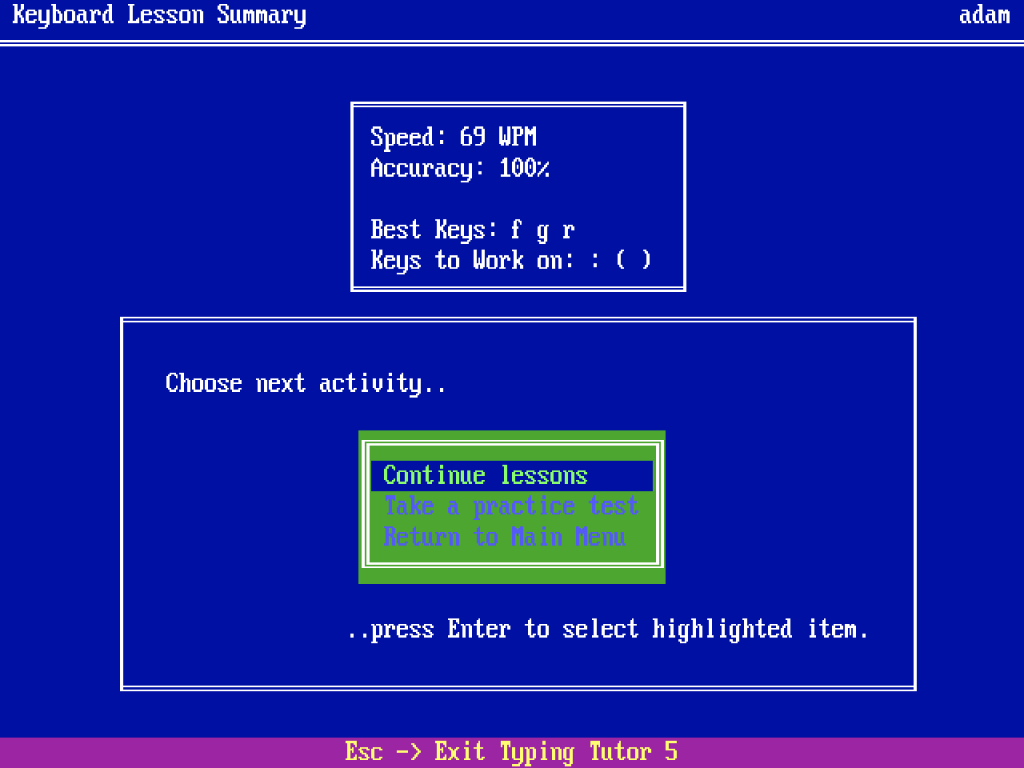
Of course, learning a new layout isn’t an overnight thing – I need proper training to learn this new layout. Thankfully this is 2022 and not 1992 when I first learned to type in a DOS typing tutor. I’ve started using the following sites to ease the transition:
- keybr.com: This is where i’m starting my lessons. It lets you pick any of a few layouts and learn them key-by-key. I’ve started with the home rows and am beginning to make progress. My plan is to become proficient in only a few keys, and only then start adding new keys, maintaining speed before progressing to the next, and so on. This site does a great job tracking progress over time, even progress per letter.
- ranelpadon.github.io/ngram-type: The next is a bigram trainer. Once I’m efficient at the layout broadly, this site helps to train common bigrams and trigrams in english. Things like
tionandingandtrthat are so common in english words. - monkeytype.com: While keybr helps train word-like typing, monkey type is true english words. Like keybr, monkeytype has great progress tracking to see how I’m improving over time
- speedcoder.net: Last is speedcoder – this is a typing tutor that let’s you use your own source files or files from their library to train. Typing english paragraphs is obviously very different than typing code, where numerous symbols are used frequently.
Each of these sites is free to use and many have progress tracking as well. They’re a great way to learn a new layout. I’m really enjoying my beginnings using keybr to learn colemak.
Until I’m proficient in Colemak, i’m going to continue using my laptop keyboard as my daily work keyboard, and train on my new keyboard with Colemak. I’m hoping that the new column-staggered layout of the Lily will muscle-memory-associate with colemake while the laptop row-staggered layout will continue to associate with qwerty.
Buying and assembling the keyboard
I haven’t done any soldering since half a lifetime ago during high school, so I was a bit intimidated jumping into the custom mechanical keyboard world. Thankfully, Ray had written up a primer of their adventure in custom keyboards, and it was a great launching off point or me.
Choosing a layout
I started in splitkbcompare, which lets you quickly see and compare various keyboard layouts, and even print them to scale to get a feel for how they’d fit your hands. I filtered by split keyboards with a number row. I was initially intrigued by the Ergodash but then settled on the smaller Lily58 layout.
Choosing a switch

I had always though all mechanical keyboards were loud, and loud was the only option. I am very glad to say I’ve since learned otherwise! Switches come in essentially 3 types: clicky, tactile, and linear. Clicky, as you might imagine, are the loud ones. Tactile are less loud but still have a pleasing feedback when typing, and linear have no tangible ‘click’ when typing – sort of. Every switch is defined by its color, which makes them easy to differentiate when you have a pile of various switches on your desk.
The sounds that all 3 of these switches share is the sound of bottoming out the key press, and then the sound when the key lifts back and hits its top when released. These can be averted in some ways by either installing O-rings, or adjusting typing to not bottom out during a keypress, or of course both.

They also come in two varieties: MX or choc. MX switches are your standard desktop keyboard switches, and choc are low profile switches more similar to a typical laptop keyboard.
For my first board, I chose the Kailh silent pink switches, and didn’t bother installing O-rings. These pink switches are linear, which will be a different feel from the macbook pro butterfly switches i’m used to, but I’m erring on the side if quiet – I wanted as quiet a keyboard as I could get without manually lubing and modifying each switch. The macbook pro keyboard requires roughly 35g of force to press, which is the same as the silent pink switch and on the lighter side of switches generally. I didn’t want to go much lighter, as some 20g switches might be easy to accidentally press.
Finding a kit
I knew that whatever I bought, I needed it pre-soldered. I could assemble the rest, but re-learning to solder was too far outside my available timeline, and I had only a 2 week Christmas holiday to get this bought and built. There are lots of options out there, and I found Boardsource which offered soldering service with their purchases.
I purchased their Lily58 kit with:
- Black PCB and FR4 black case
- Diodes
- MX hotswap sockets
- Choc hotswap sockets
- Elite-C
- Assembly service
- 6 packs of 10 Kailh Silent Pink switches
It came out to ~$230 or so, which was well within my budget for preventing a lifetime of pain. I’ve only bought MX switches for now, and will try choc switches and caps sometime in the future.
Key caps
My initial Kailh pink switches are MX style switches – traditional keyboard switches – so i needed to buy keycaps for these as well. I wanted different colored keycaps for different positions on the board. I thought about fully blank caps so that I wouldn’t use the keys as a crutch when learning Colemak. Some cap styles also have slightly different heights for the different rows, and I didn’t want to lock myself into a Colemak set if i chickened out and switched back to qwerty later.
Then genius struck – if I can find somewhere to costom print keycaps, then I can put Tolkien’s dwarven runes on the caps. Instant nerd happiness.

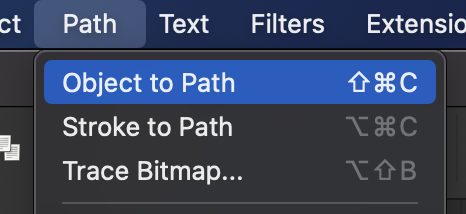
I found MaxKeyboard’s custom print option, which let me choose per-key color, as well as upload svg artwork to print on each keycap. I downloaded their template, found a Tolkien font, and used Inkscape to add the dwarf glyphs. One important thing in the template readme was to convert each character to a vector path, which wasn’t too hard to find in Inkscape. Thankfully, the MaxKeyboard folks double-check your artwork before printing, so if anything is amiss they should reach out to you just in case. I’ve provided my svg below:
I chose a spacebar length that gave me a mix of 1.5u and 2u keys. I wasn’t sure which I’d want on the thumb keys of my Lily, so getting a few of each gave me options.
Assembly
I followed the canonical build guide, skipping past the soldering parts at the beginning since mine is pre-soldered. Assembly took about an hour or so and was painless. It was a lot like assembling a lego set, just following the guide and enjoy the process.
After getting it together, I plugged it into my laptop which immediately recognized it as a keyboard device. I tested each key on this site to make sure that everything was working correctly. I found one switch that wasn’t working, pulled it out gently with some needle nose pliers to find out that one of its pins had snapped off. Swapping that switch for one of my two backups and it worked perfectly.
Configuring with QMK
I started with the default Lily58 layout on QMK Configurator. From there, you can drag and drop keys to new locations, and setup new layers. As I worked, I would download json files of the layout as a backup – one you reload the page your work is gone, so it’s important to keep it saved somewhere. It’s also useful to edit the json directly, as I wasn’t able to find a way in the configurator to move layers positions.
The QMK documentation is extremely helpful as well – there’s so much that’s possible with this firmware it’s mind bending. It was particularly helpful to me to read about how layers are configured and switched between. The concept of one-shot keys is also intriguing, and I’ve setup my shift keys to be one-shot.
Like all things, there are infinitely more possibilities if you code the firmware yourself, but i stuck to what was available in the online configurator.
When I was done, I compiled it on the site, and then downloaded the source and binary. The binary firmware is a .hex file that can be loaded directly onto the keyboard.
To flash the firmware, download the QMK Toolbox. Then, plug in the keyboard, press the keyboard’s reset button, and it should show a message in the toolbox that the keyboard is connected:
*** Atmel DFU device connected: ATMEL ATm32U4DFU (03EB:2FF4:0000)Then choose your .hex file and controller type from the dropdown, for me that’s ATmega32U4 based on the connection string above. Then click Flash and you’re off to the races!
Note: This will flash half of your keyboard – the half that’s connected via your USB cable. You’ll need to switch the cable to the other half and flash that one as well. Then move the USB cable to whichever side is the left handed side.
That’s it! Now the keyboard has your custom keymap loaded. You can test it on the key testing site above, or QMK Toolbox includes a key-test window as well.
The next keyboard
So far I’m really liking this keyboard, but I have some more things I’d like to try.
Low profile choc caps

First, I’ve bought a number of different choc switch types from mechbox.co.uk to test, both tactile and linear. I enjoy the linear but feel I should at least see what the options are. I also want to see how low of a profile I can get this board. It currently sits maybe an inch from the table to the top of the keycap, and I’d like to lower as much as I can.
I’ve ordered some white and colored choc keycaps from mkultra. Unfortunately, many colors were out of stock, but I was still able to get some variety.
Custom dye-sub my own caps
While there’s tons of customization possible with MX caps, choc caps have much less variety. This video came across my YouTube feed and describes how to dye-sub your own keycaps with whatever design you want. What’s needed is a dye-sub printer, dye transfer paper, a PBT material keycap, and a flat iron. The choc caps I bought above are PBT (ABS is the other common material, but would melt for this case).
My wife loves Cricut, and has made numerous cards, shirts, and signs for our family and as gifts. Her current model can cut paper and vinyl, and she’s been eyeing one that can cut or draw dye-sub ink. We’ll be upgrading her cricut for her projects, and I’ll get a chance to try dye-subbing some keycaps as a bonus.
Thumbstick or trackpoint

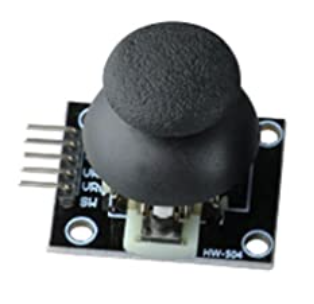
The Lily58 has a variant prepared for a rotary controller, which could be a nice tool for scrolling without a mouse. I’d love to be able to get rid of the need for a trackpad altogether though, and fitting a thumbstick or trackpoint in that position would let me control the mouse without moving my hands – perfect!
I’d love a rotary controller on the left as a ‘scroll wheel’ and a thumbstick on the right as a mouse replacement.
The adventure continues!
I’ve really enjoyed diving into this custom mechanical keyboard world, it’s been a lot of fun to find something that’ll help me and add some personalization to it too. Here’s hoping I can learn Colemak DH as fast as I think I can… ha!


