I’ve been spending the past week of Loose Leaf development tracking where and how my app’s memory is allocated at run time. My goal is to send all of my memory stats to MixPanel with every event I track. During beta and after launch, all of this information will help me to better understand how people are using the app.

This’ll be especially helpful if/when I get memory crash reports – tracking down which iPad models are having the hardest time, and being able to use MixPanel to see how Loose Leaf is allocating memory on those iPad models – is it OpenGL textures? Vertex buffers? UIImages? Core Animation?
Knowing how the app’s caches are performing, where memory is allocated, and why it’s allocated is going to be a huge help to further optimize performance after launch.
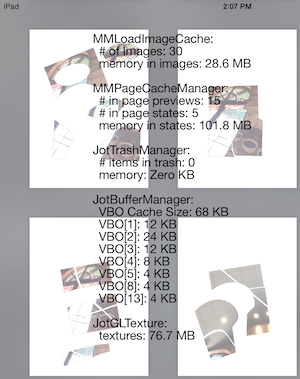
My end goal is to have similar memory allocation numbers at runtime that the Allocations tool in Instruments gives me when profiling. So far, I have the following debug screenshot that shows how and where memory is allocated in the app. The important numbers from the screenshot are the 28.6Mb of memory in the MMLoadImageCache (these are UIImages), and the 101Mb in the MMPageCacheManager (this is largely OpenGL, including the Textures and VBOs later in the screenshot). These sum to roughly 130Mb of actively allocated and used memory.
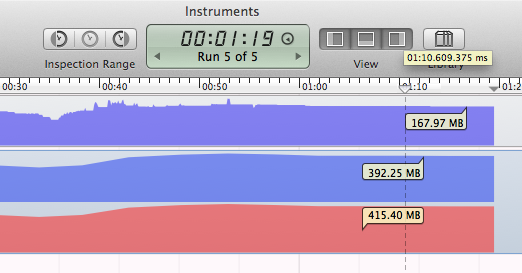
I also have a few views that rely on drawRect:, and those views have their backing store created by Core Graphics. All this together can account for the 167Mb of memory that Instruments shows me in the Allocations instrument.

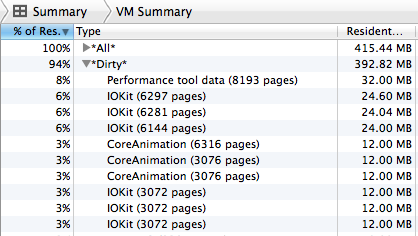
What’s going on with that 392 Mb of dirty memory?! Yikes, this number is over double my allocations and is absolutely terrifying. After some research, I found this post about Finding iOS Memory, which mentions that OpenGL’s textures are shown Dirty memory labelled as IOKit. Sure enough, i see lots of IOKit memory when I look at dirty memory:

This makes me worry that perhaps I’m not cleaning up old textures properly, and I’m somehow leaving my memory allocated in OpenGL after I’m finished with a texture. Looking through my code, I’ve confirmed I’m calling “glDeleteTextures(1, &textureID);” for my texture IDs like I should – so what could the problem be?
Then I found this answer on StackExchange, which mentions:
Some drivers may keep the storage allocated so that they can reuse it for satisfying future allocations (rather than having to allocate new storage – a common misunderstanding this behaviour leads to is people thinking they have a memory leak), other drivers may not.
If that’s true, then that’d mean that I have done my job and properly released that memory, and OpenGL is just optimizing when it actually frees that memory back to the system.

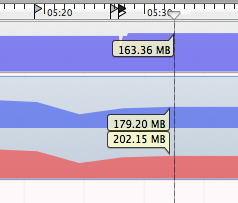
To test this out, i background my application and open up Pages, Keynote, and Numbers in an attempt to force a Low Memory Warning on the system. Instruments shows these memory events being triggered while my app is in the background, and more importantly it shows the dirty memory falling back into line with my current allocations. When I return to my app after opening a few apps and browsing around outside my app, Instruments now shows dirty memory much closer to my current allocations:
Moral of the story: Keep a close eye on allocations and dirty memory, and make sure you know why and when your memory is marked as dirty. It turned out that Loose Leaf is doing a good job cleaning up its old unused OpenGL textures, but OpenGL is just slow when it deallocs that memory. I may try to do a better job loading new textures into old texture’s memory and purposefully re-using memory instead of always allocating new, but I’m glad to see that I didn’t have a massive leak after all.